Operaio SCSM Archive - User Guide
The Operaio SCSM Archive consists of three main components: the archive, a search and access function via your browser, and a reporting tool. It thus offers a fast and intuitive alternative to the SCSM Data Warehouse.
Features
- archives your data
- reduces the workload of the service manager without losing data and thus increases its performance
- allows data anonymization
- is searchable with a search tool
- reporting dashboard (coming soon)
Archive
The Archive allows you to regularly archive the data of your SCSM Database.
You define what data shall be synchronized and how often.
This also allows for data anonymization. As an example you could configure the archive to import only the bare minimum of information for the DomainUser Class and get rid of clear names, addresses or any other unwanted data during the synchronization process.
In addition, you can migrate existing archives, such as the System Center Data warehouse, to your Operaio SCSM Archive.
Note: The configuration of the Operaio SCSM Archive is created and maintained by Operaio GmbH.
Contact us if you'd like to make changes to your current configuration: support.operaio.ch
Search Tool
The Search Tool for the Operaio SCSM Archive is a web based search engine allowing for easy access to your archive data.
It features a simple and an advanced search function, as well as distinct and customizable forms for all common SCSM WorkItems.
Simple Search
The Simple Search is the first thing you see whenever you navigate to your Search Tool for Operaio SCSM Archive
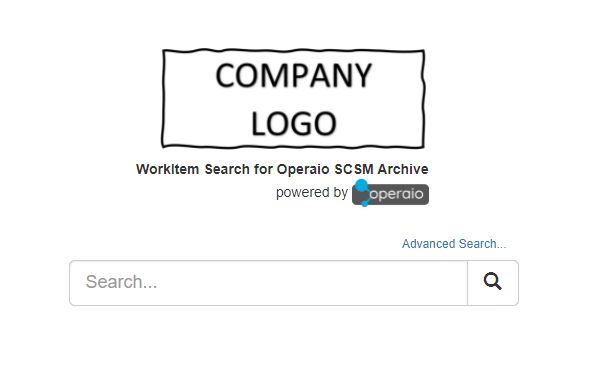
This search will return all WorkItems where any of the following properties contain your search term:
- WorkItem Id
- Affected User's DisplayName
- Affected ConfigItems DisplayNames
- WorkItem Title
- WorkItem Description
- Attachment filenames
Note: The simple search configuration can be customized. The list above corresponds to the default configuration but may vary from yours.
Advanced Search
You can access the Advanced Search by clicking the Advanced Search... link near the simple search dialog.
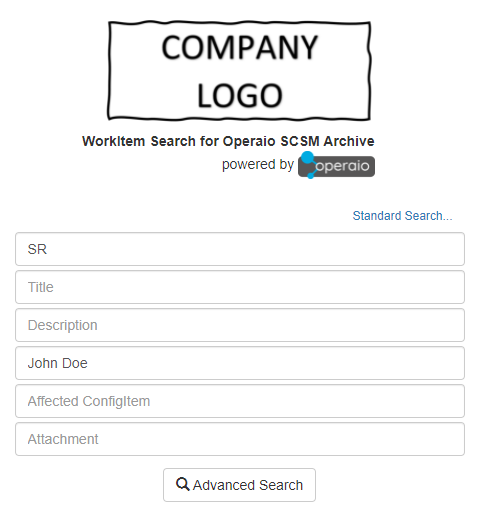
Using the Advanced Search allows for more specific search queries. It will return only WorkItems where all of the following properties contain the search term specified in the corresponding text-boxes.
- WorkItem Id
- Affected User's DisplayName
- Affected ConfigItems DisplayNames
- WorkItem Title
- WorkItem Description
- Attachment filenames
Any text-box left empty will be ignored.
Example:
To find all Service Requests where John Doe is the affected user, you can use the Advanced Search, specify SR as WorkItem Id and John Doe as Affected User and finally click the Advances Search Button.
Only Items containing SR in their Id and John Doe in the display name of the Affected User will be returned by this query.
Note: The advanced search configuration can be customized. The example above corresponds to the default configuration but may vary from yours.
Search Results
The Search results lists all WorkItems found in a convenient way, previewing the following properties already:
- Display Name (Id - Title)
- Affected User
- Description
- Last Modified Date
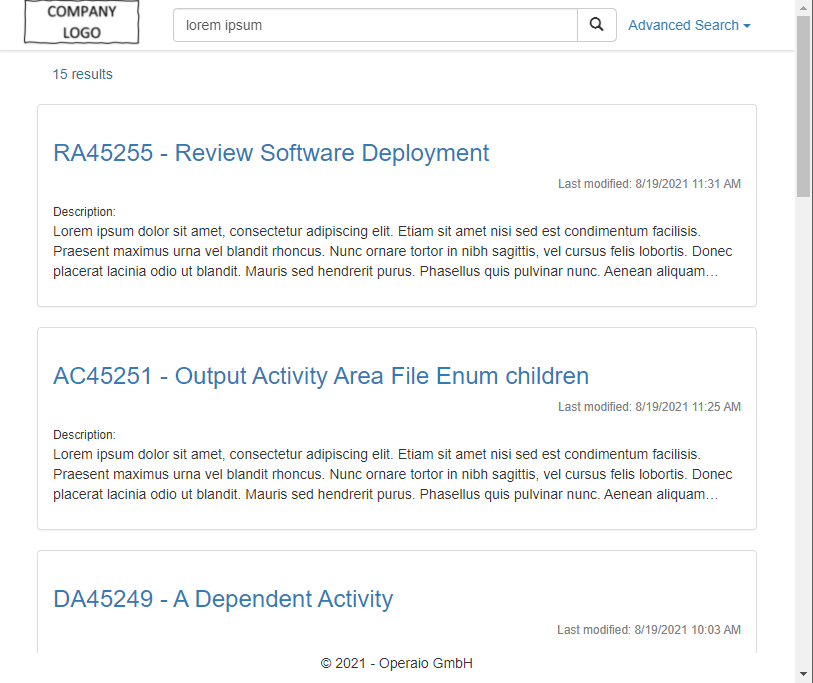
The search results are ordered by the Last Modified Date.
Click on any of the returned item's display name to access its form.
Forms
The Search Tool for Operaio SCSM Archive includes Forms for all the common SCSM WorkItem types.
These Forms are designed to mimic the layout of the existing default forms available in the SCSM Console, but can be customized if required.
You may also create new, custom Forms to accommodate your class extensions or custom classes.
By default, the Search Tool contains Forms for the following class types:
- System.WorkItem.Incident
- System.WorkItem.ServiceRequest
- System.WorkItem.Problem
- System.WorkItem.ChangeRequest
- System.WorkItem.ReleaseRecord
- System.WorkItem.Activity.ReviewActivity
- System.WorkItem.Activity.ManualActivity
- System.WorkItem.Activity.ParallelActivity
- System.WorkItem.Activity.SequentialActivity
- System.WorkItem.Activity.DependentActivity
- Syliance.WorkItem.Activity.ChecklistActivity
- Syliance.Activity.FormFillingActivity
- SCSMSolutions.WorkItem.Activity.PowerShellActivity
Reporting Dashboard
With the Reporting Dashboard, you can view predefined reports or create your own customized dashboards. This gives you an overview of your service requests, incidents, etc. and provides you with the basis for confident planning.
Creating Reports
You may create your own, custom reports using the Reporting Dashboard UI.
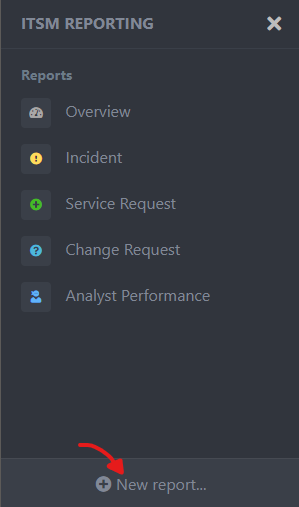
To start, click the "New Report" button at the bottom of the navigation sidebar.
On the new report form, you must specify a name for your report.
Optionally you may specify an icon, icon color and description for your report.
Default Values
If no icon was specified the UI will use the default icon:
If no Description was specified, the UI will show the default description:

Next, you may add charts to your report as described in the chapters Add Charts to reports and Modify or delete Charts.
Finally, save your new report using the Save button - or discard your changes using the Cancel button.
Modify or delete Reports
Navigate to the report you want to modify or delete using the navigation sidebar.
Once the report is loaded, use the report-menu and select the desired action.
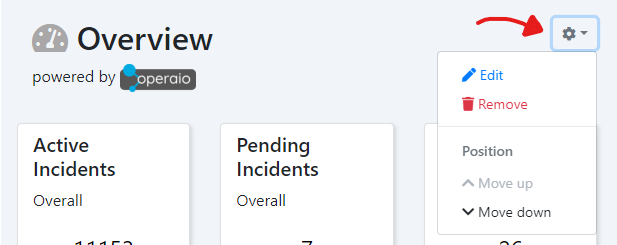
- Click the
Editmenu-item to open the report's edit form. - To delete the report, click the
Removemenu-item.
Remove Report
Clicking theRemovemenu-item will remove the current report permanently! This action cannot be undone and the UI will not ask the user for confirmation!
- Use the
Move upandMove downmenu-items to change the report's position in the navigation sidebar.
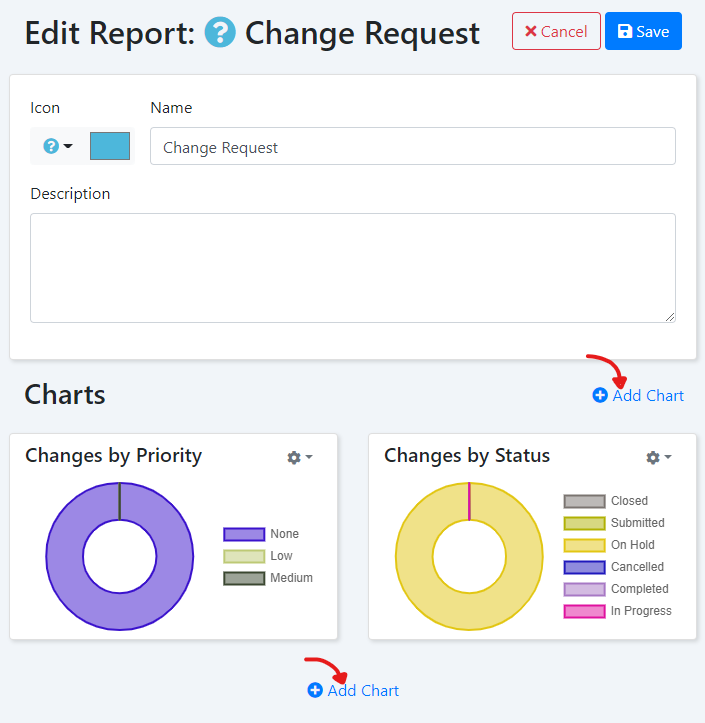
Add Charts to reports
When creating or editing a report, you can use the Add Chart buttons to add a new chart to the report.
On the Chart edit form you have several options available, described below:
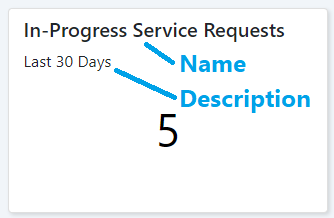
Name (required)
The Name is displayed as title of the chart on your report form.
Description
The description text is displayed as paragraph below the charts title
Type (required)
Specify the type of chart you want to create. The following different types are currently available:
Number
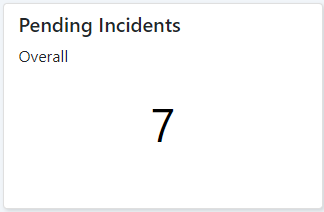
The number chart's intention is to show a single number. However, you may actually use it to display any sort of formatted text (e.g. dates, times, names etc.).
The number chart always shows the data of the first column in the first row returned by your Query (see Query chapter for further details)
Bar-, Line, and Mixed-Chart
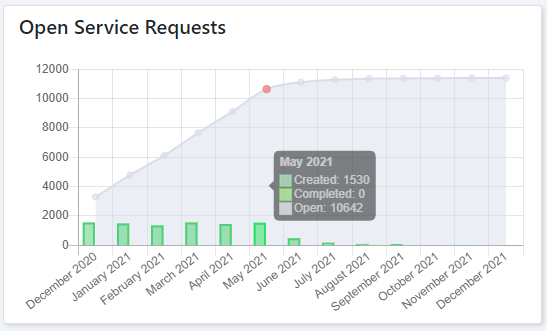
These chart types allow you to represent multiple datasets (see Data-Mapping) as either lines, bars, horizontal bars or mixed (bar & lines) charts.
Doughnut- and Pie-Chart
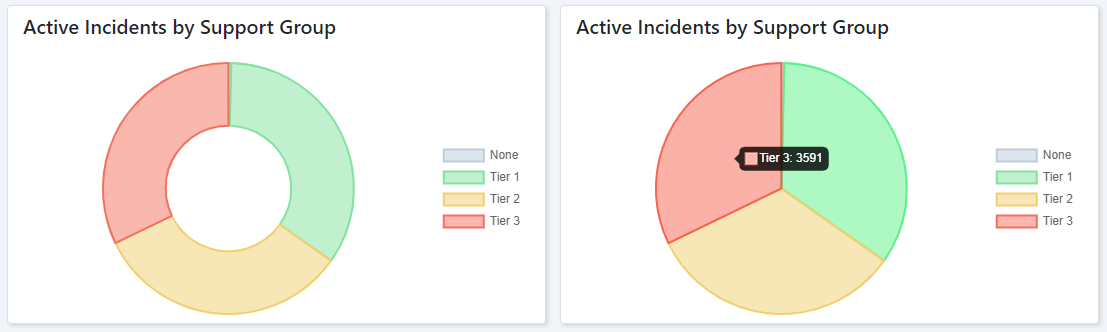 These chart types allow you to represent a dataset (see Data-Mapping) as either a doughnut or pie chart. You may represent multiple datasets but this might yield in a difficult to read chart.
Legend
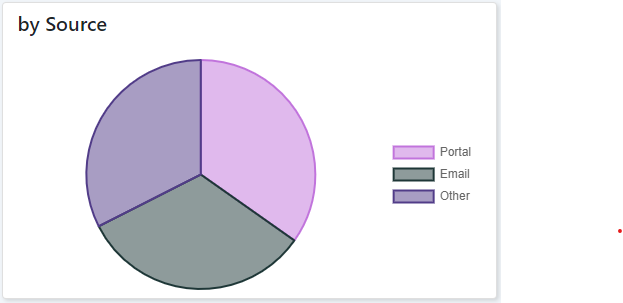
This option allows you to define the position of the chart's legend, or to hide the legend. The example above shows a pie-chart with a legend on the right side.
Not available for number charts
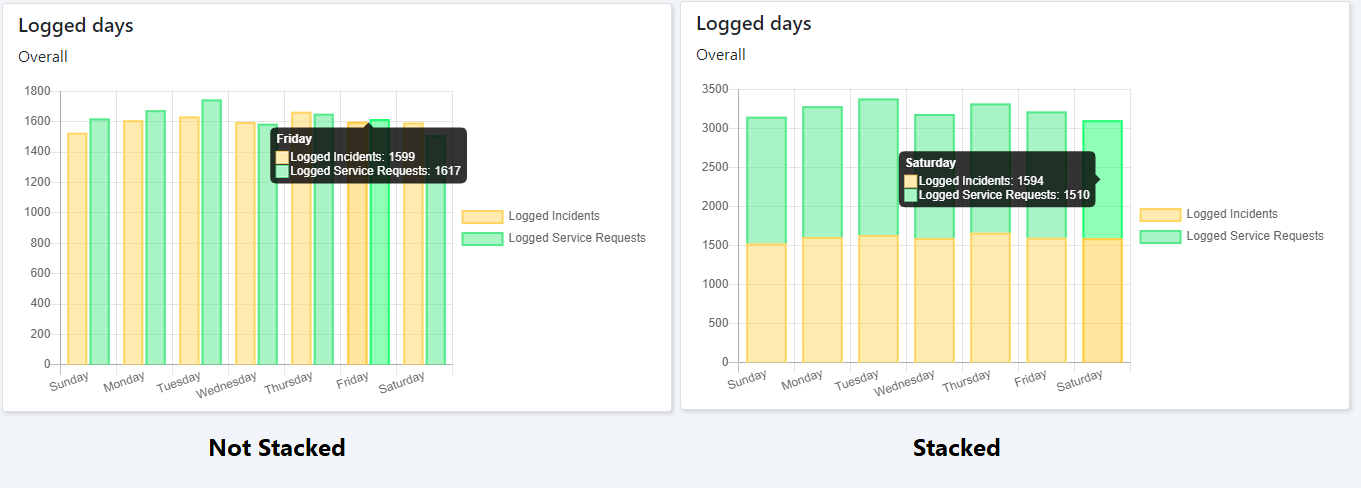
Stacked Chart
This option is only available for the Bar-, Line- and Mixed-Charts. It allows to stack multiple datasets (columns of your query) onto each other.
Query
This prompt is used to specify the SQL Query that is being executed on your archive database to return the desired data.
What tables and columns are available in for these queries depends on your archive's configuration - Ideally you are able to connect to the archive database using the SQL Management Studio to explore your database.
Click the Execute Button whenever you want to test your query.
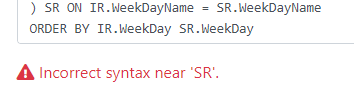
If the query failed you will see a corresponding error message below the query prompt.
If the query was successful the query result is displayed in a table below the query prompt.
Example:
Consider the following SQL query for the bar chart shown in the Stacked Chart section:
SELECT
    ISNULL(IR.WeekDayName, SR.WeekDayName) AS WeekDayName,
    IR.Count AS count_IR,
    SR.Count AS count_SR
FROM
(
    SELECT
        DATENAME(WEEKDAY, CreatedDate) AS [WeekDayName],
        DATEPART(WEEKDAY, CreatedDate) AS [WeekDay],
        COUNT(*) AS [Count]
    FROM dwh.WorkItem$Incident
    GROUP BY DATENAME(WEEKDAY, CreatedDate), DATEPART(WEEKDAY, CreatedDate)
) IR
FULL OUTER JOIN
(
    SELECT
        DATENAME(WEEKDAY, CreatedDate) AS [WeekDayName],
        DATEPART(WEEKDAY, CreatedDate) AS [WeekDay],
        COUNT(*) AS [Count]
    FROM dwh.WorkItem$ServiceRequest
    GROUP BY DATENAME(WEEKDAY, CreatedDate), DATEPART(WEEKDAY, CreatedDate)
) SR ON IR.WeekDayName = SR.WeekDayName
ORDER BY IR.WeekDay, SR.WeekDay
This query will result in the following table:
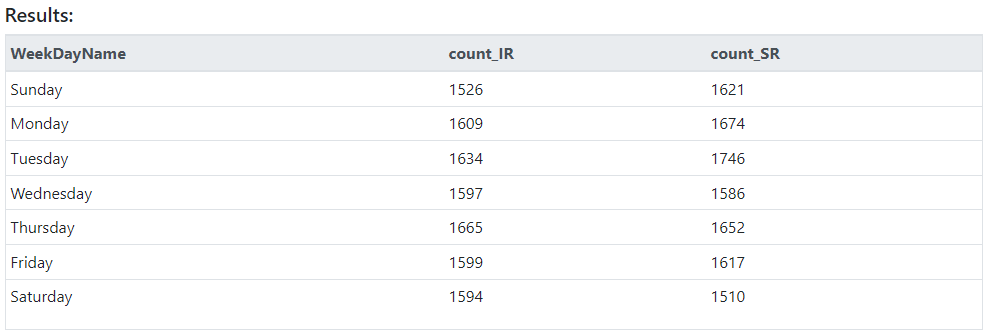
This data looks about right and can be mapped to the bar chart as described in the next section
Data-Mapping
Not available for number charts - these charts always use the data of the first column in the first row of your query-results, therefore no mapping is required.
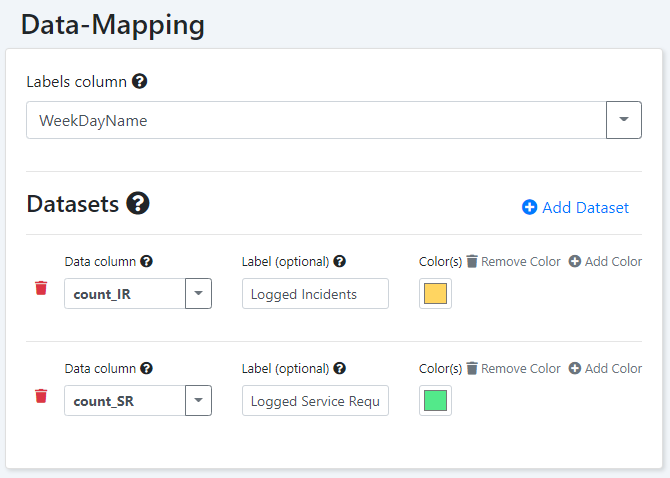
The Data-Mapping section allows you to create data-sets based on columns of your query results. Also, you may define what column is used to label each record of a dataset.
Labels column
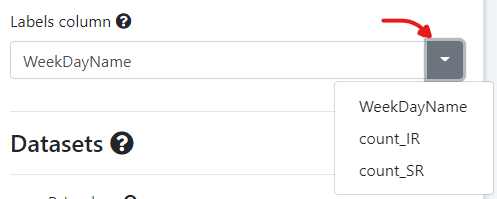
Use this prompt to specify which column shall be used to label your chart's x-axis. In the example above this would be the column WeekDayName.
If you do not define any column-name for this prompt, the first column of the query results will be used as labels.
If you executed your query already you can use the dropdown button on the Labels column prompt to quickly select one of the columns returned by your query:
Datasets
Each dataset represents a column of the table returned by your SQL query.
If you want to display a column of your query result as e.g. a set of bars on your chart, you must add a corresponding dataset using the Add Dataset button.
Define what column the dataset shall represent in the Data column prompt.
Optionally you may define a label for the dataset in the Label prompt. If no value is defined for label, the value of the Data column prompt will be used as label for the dataset.
Add a color using the Add Color button to define the color of your dataset (e.g. the color of the bars). You may also define multiple colors if you wish to have each record of the dataset colored differently. This is especially useful for pie- and doughnut-charts.
When you are done with your data-mapping, click the Execute button in the Query section again to update your chart's preview.
Apply your changes by clicking the Apply button, or discard the changes using the Cancel Button.
Note: Clicking the
Applybutton will not yet create or update the chart in the database. You must click the Save button of the chart's report to actually commit your changes.
Example
Have a look at the example Dataset configuration of the chart shown in the Stacked Chart section as a reference:
Modify or delete Charts
On the report edit form, use the chart's config-menu button to select the desired action for that chart:
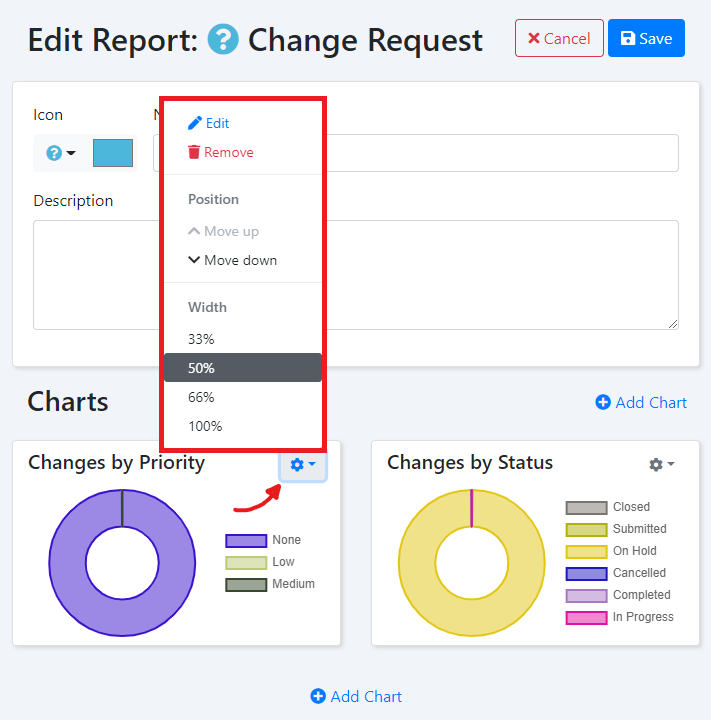
- Click the
Editmenu-item to open the chart's edit form - Click the
Removebutton to remove the chart form its report. - Use the
Move upandMove downmenu-items to change the chart's position in the report. - Use the
Widthmenu-items to set the chart's dynamic with for large and medium screens (small screens will show all charts with 100% width).